Articles with tag #matplotlib:
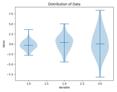
Violin plots in matplotlib
I recently stumbled over some very useful but little know function provided by Matplotlib, called
violinplot()
and I wanted to share this with you. The function creates a so-called violin …
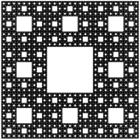
Visualizing the Sierpinski Carpet in Python
Fractals are fascinating mathematical objects that have captivated the attention of scientists, mathematicians, and artists alike. One of the most famous fractals is the Sierpinski Carpet, which is a self-similar …
Visualizing the Electric Field of a Dipole in Python
In this article, we’ll discuss how to visualize the electric field of a dipole using Python and the Matplotlib library. We’ll also provide some background on electric dipoles and the …

The Lorentz Transform Visualized with Python
T he Lorentz transformation is the backbone of special relativity and encapsulates all its bizarre and intriguing effects like time dilation, length contraction, and breakdown of simultaneity. Although easy to …

MATLAB-like Waterfall Plots In Python
In the Python scientific world, matplotlib is the top dog when it comes to plotting. There are also other great packages, like Bokeh or plotly but matplotlib is still the …